
PART II: Financial Report Infographic (Canva)
Step 5: Review Your Data
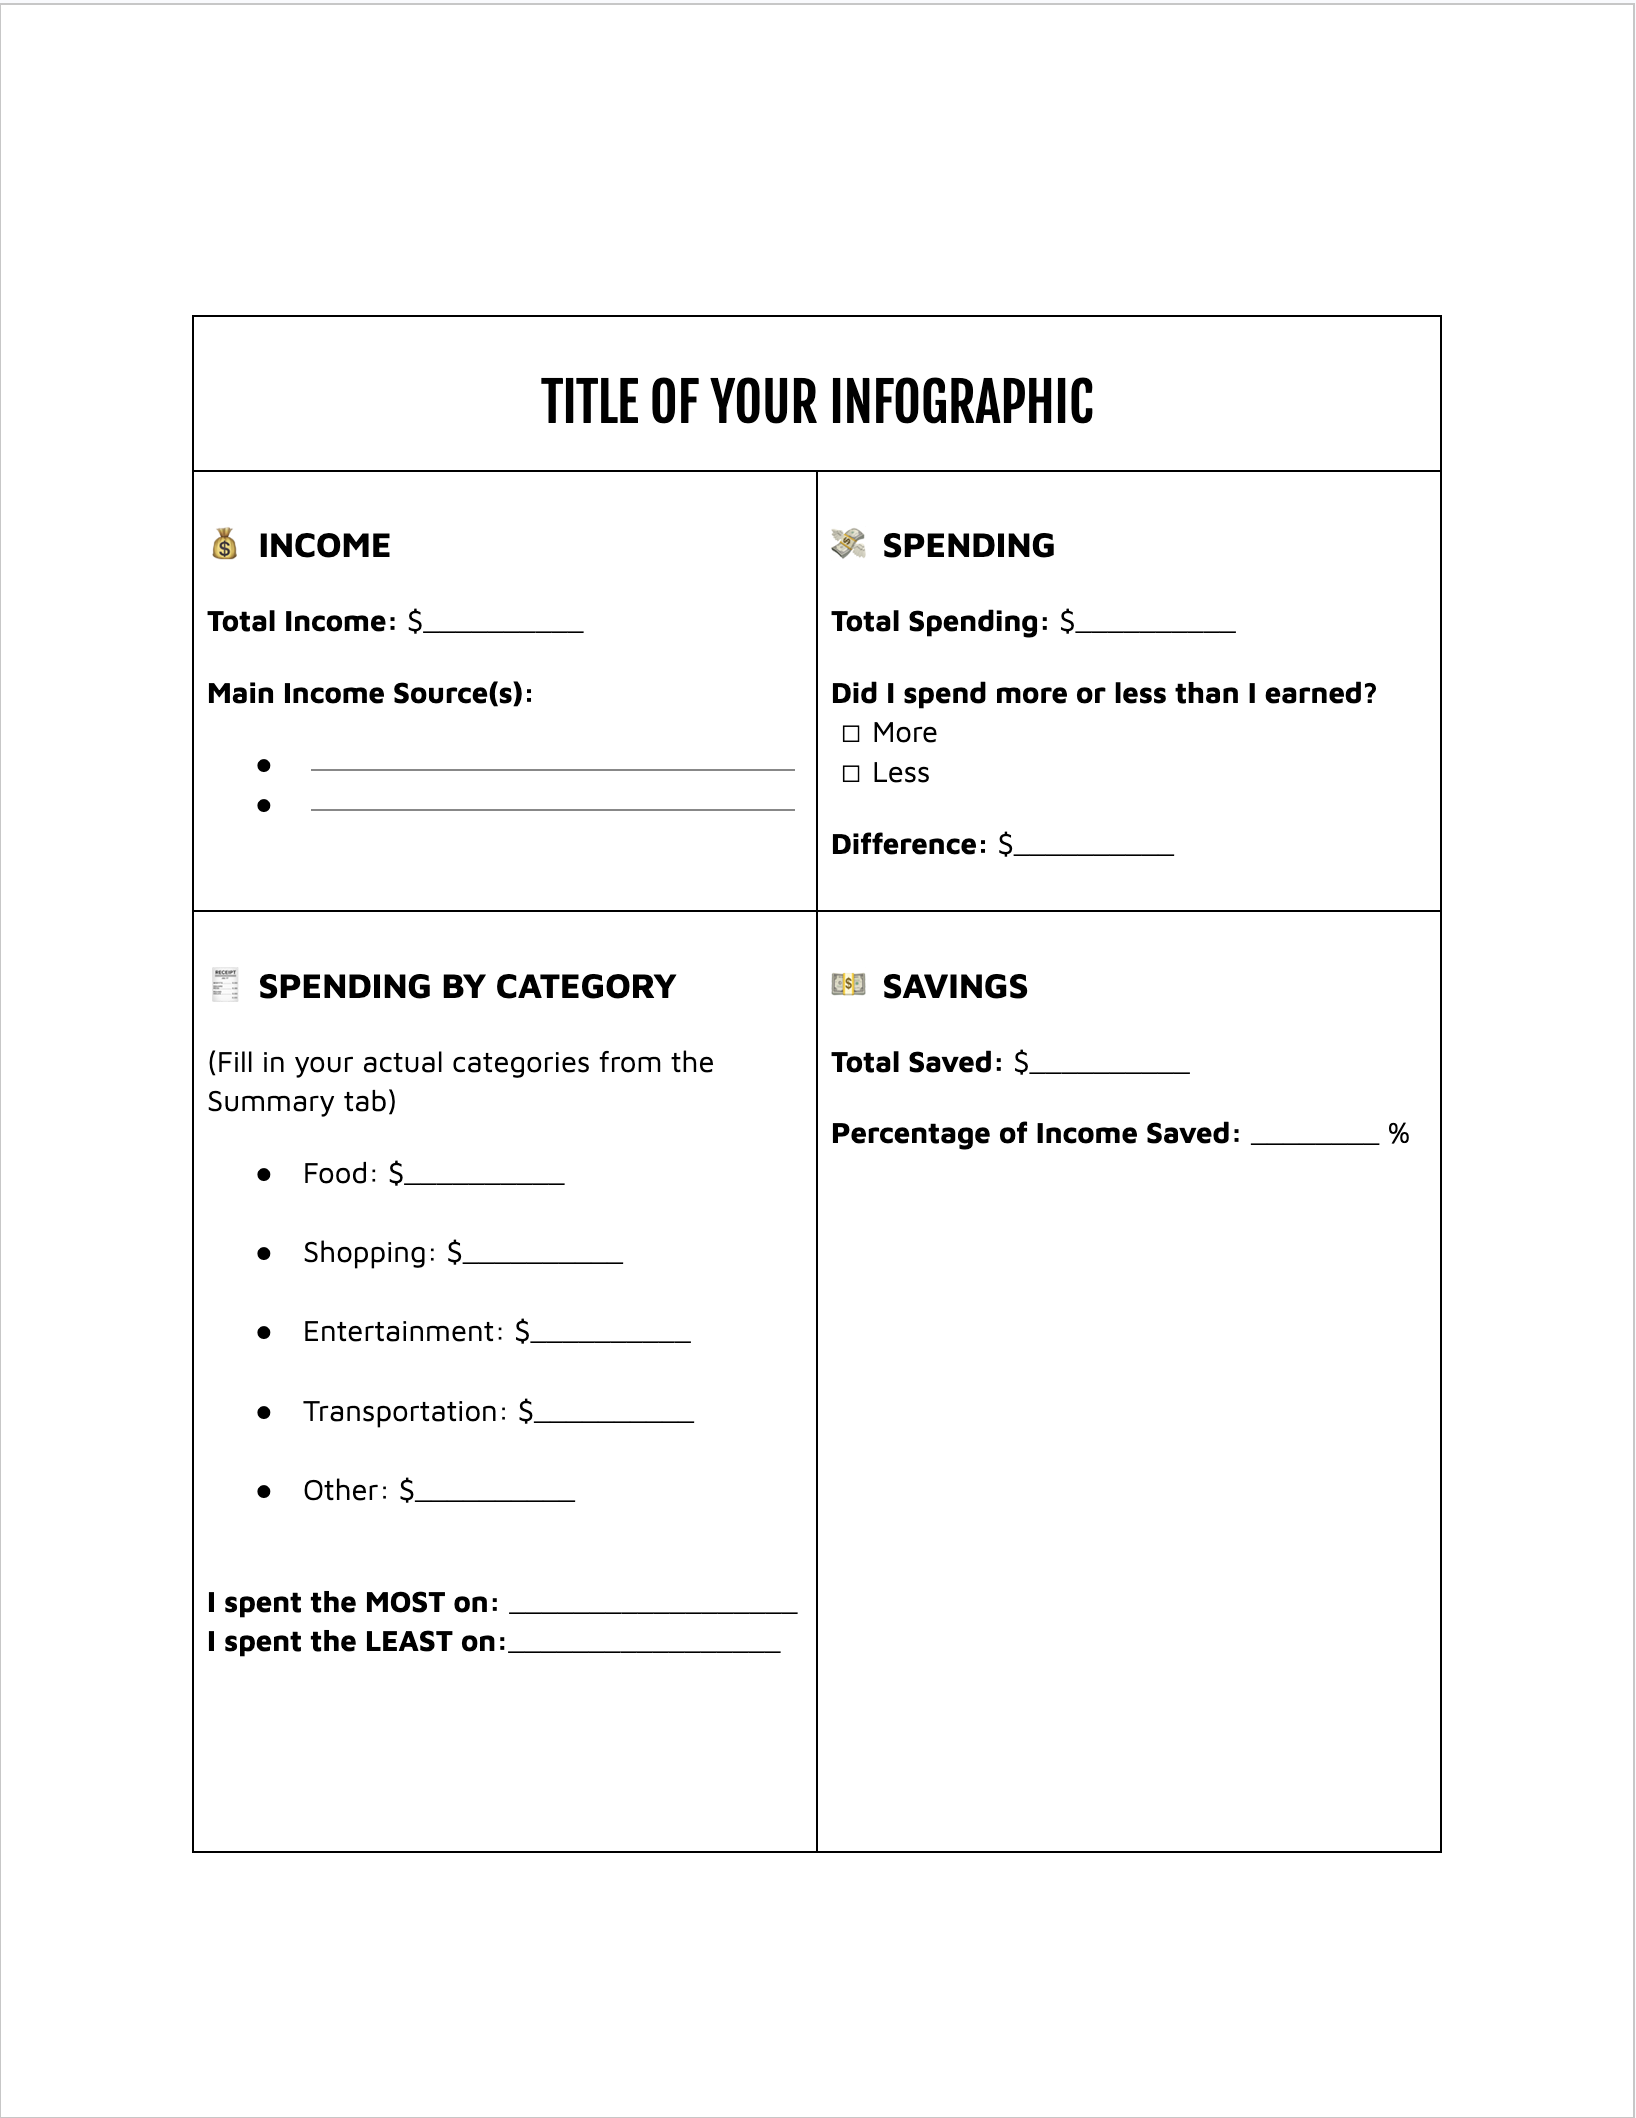
When the month is finished:
- Go to the Summary tab.
- Look at:
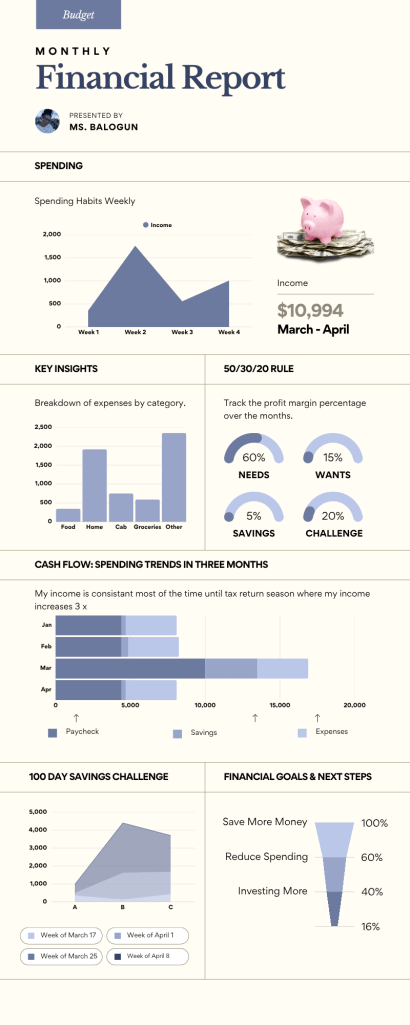
- Total income
- Total spending
- Spending by category
- Savings
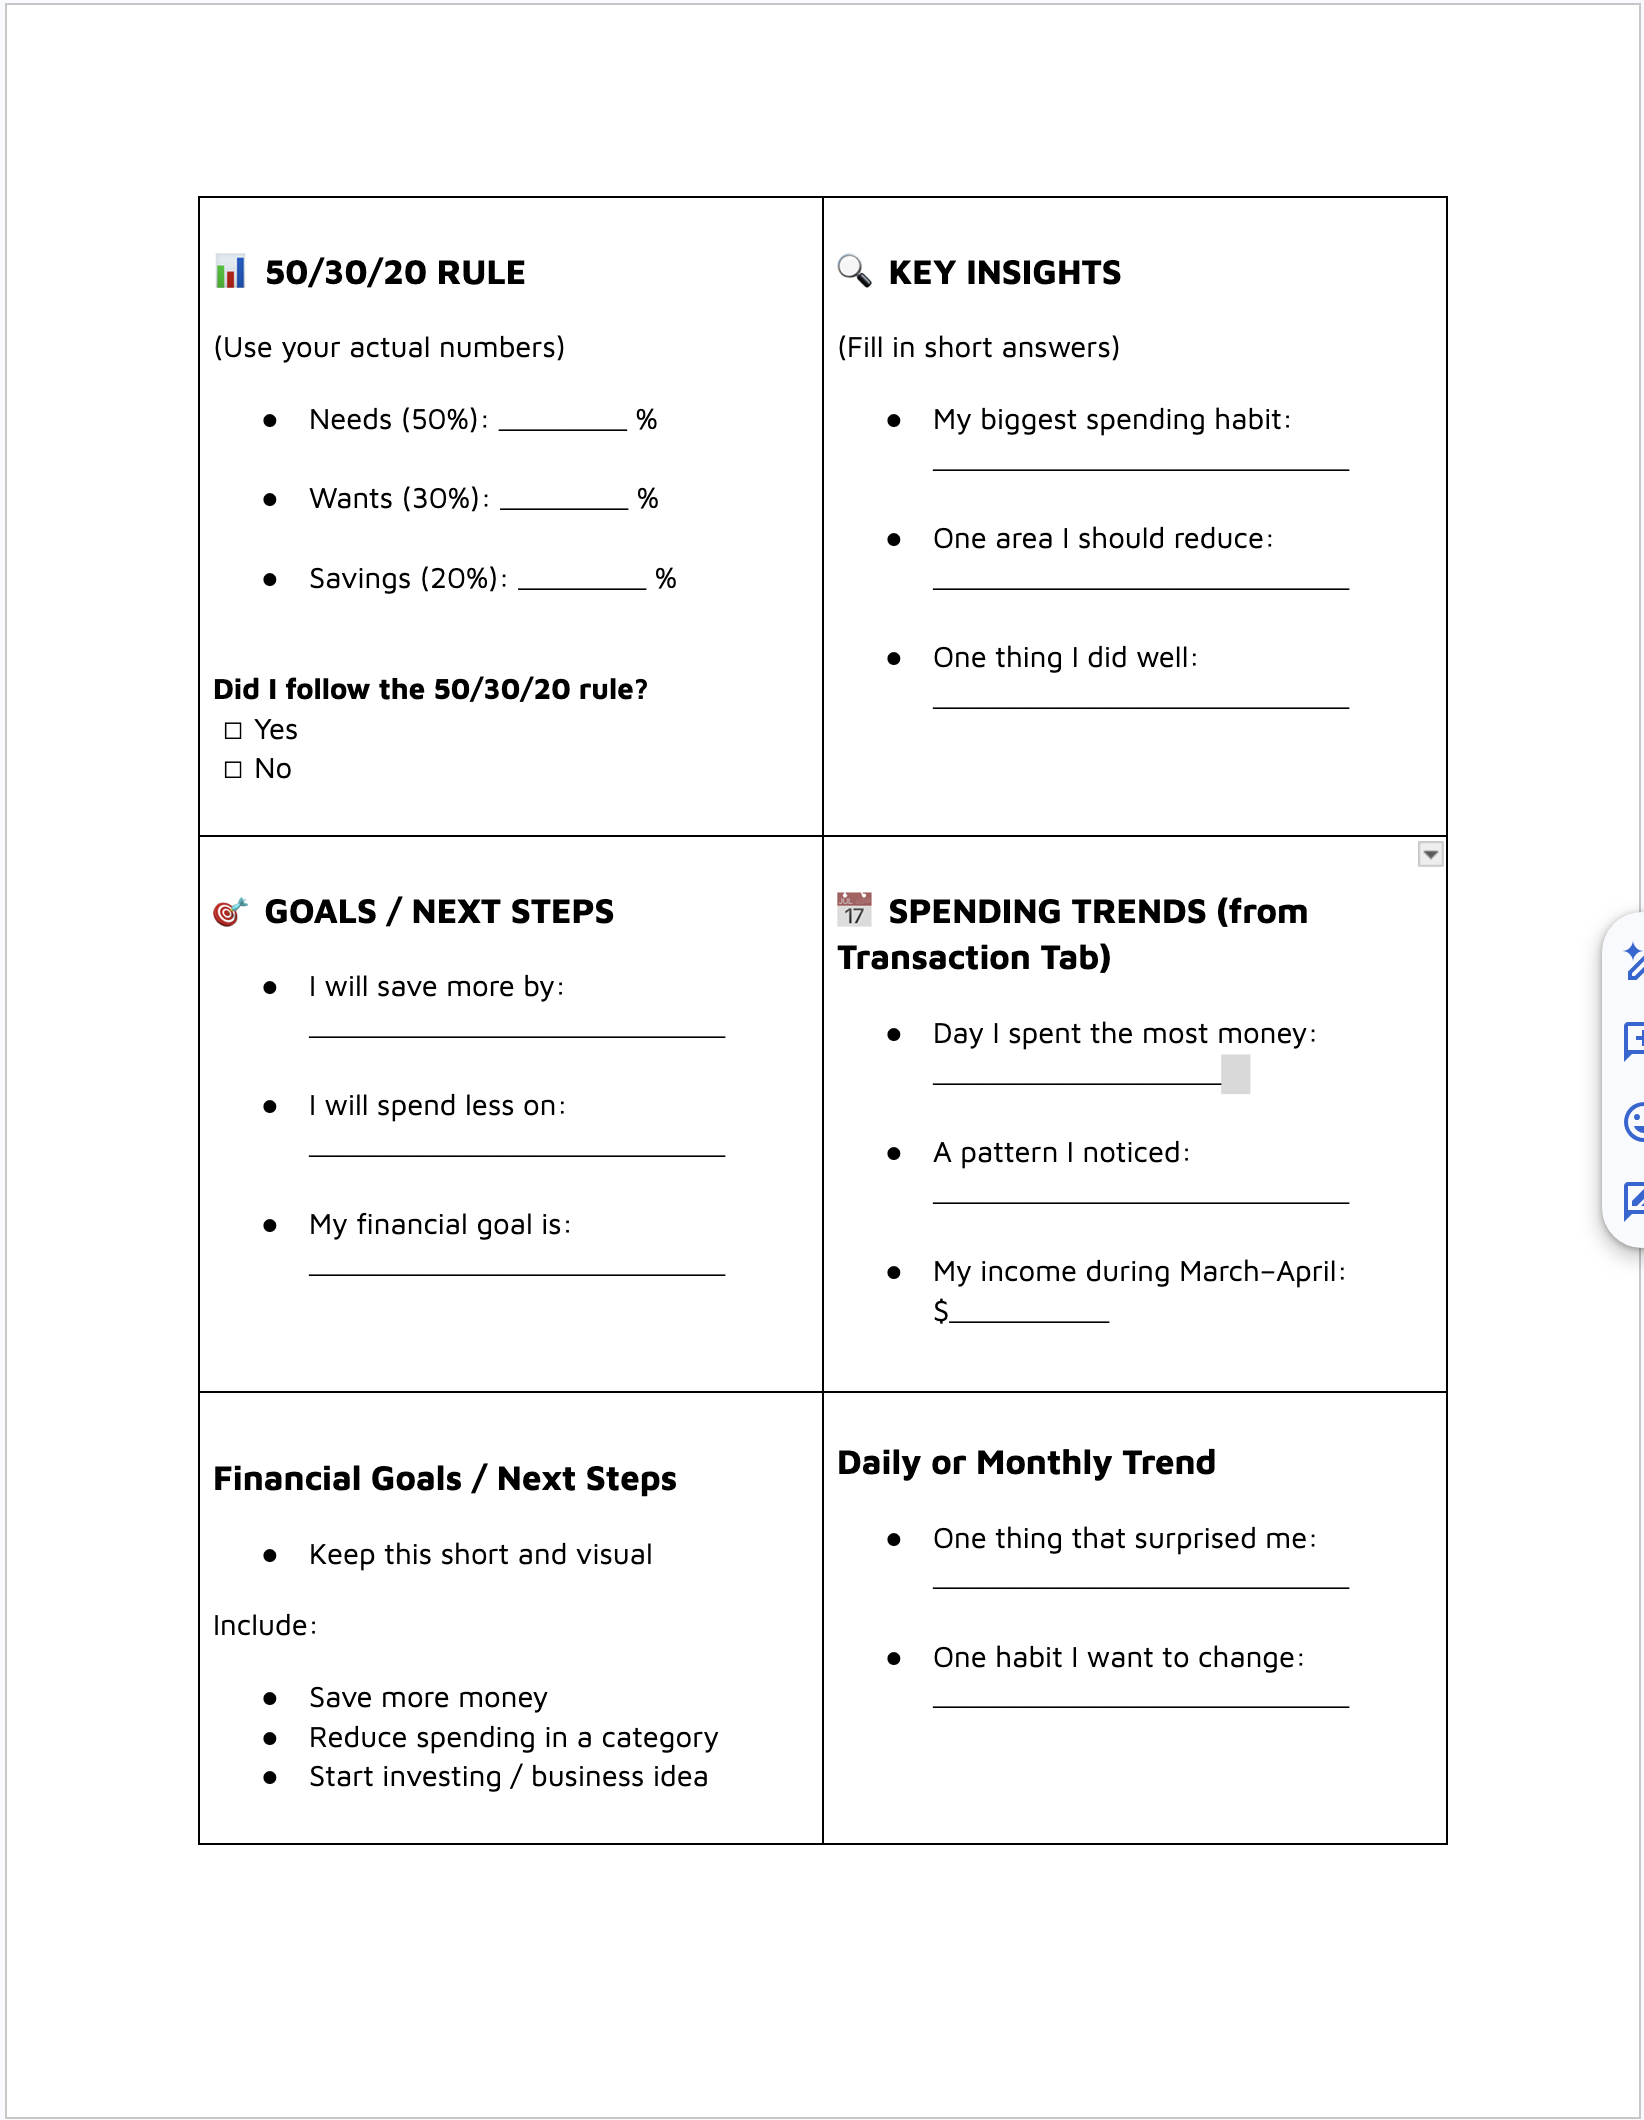
- Go to the Transaction tab
- Look at:
- How much you spent on any given day
- How much income you accumulated during the month of March-April
Directions: The document has 10 categories fill out all the categories and then decide on 7-8 out of the 10 to show on your infographic.
You will use this information to create your infographic. Attached to the assignment is a Google Doc to help you choose what Categories you will create graphs, pie charts, line graphs, and/or bar charts. To show how money flowed throughout the 30 days.
Step 6: Create an Infographic in Canva
- Go to the Performance Task assignment in Google Classsroom and click on the Canva template Link attached. Make sure you log into our Canva Classroom!!!!
BEFORE YOU BEGIN!!!!
Change the filename at the top of the document ‘Copy of yourname’ to your own first and last name before beginning to edit in Canva. When the document opens, click on the template icon and search for financial report, budget report, or monthly financial report infographic, and find a template to your liking.
- Search “Infographic” in templates.
- Choose a design you like.
- How to edit Charts and Graphs Video: This video has chapters on different charts and graphs. if you need help fixing your chart/graph use the video below.
- After you chosen a template make sure that you can use most of the charts displayed on it. If a chart doesn’t suit your needs you can always replace the chart with another one using the elements tab in Canva to find one.
Part III: Write Your Reflection
Step 7: Reflection Document
Open a the attached document in the assignment and write two paragraphs. Each paragraph must have 5–6 sentences. Use the Summary tab to help answer the questions below.
Paragraph 1: Budgeting and Spending
Explain:
- What are the benefits of tracking your income and spending habits?
- What are rules to live by when budgeting?
- How does tracking money help inform your spending decisions?
- Did grouping your expenses (shopping, food, entertainment) help reduce your spending?
Paragraph 2: Financial Planning
Explain:
- Did you use the 50/30/20 Rule? Why or why not?
- What are your wants vs. needs now that you understand your income better?
- What are your financial priorities moving forward, such as:
- Savings
- Retirement
- Investments
- Starting a small business
- What changes will you make to your income or spending after reviewing your budget?
Use specific numbers from your spreadsheet to support your answer.- Savings
- Retirement
- Investments
- Starting a small business
Include the following information from your budget:
- Total monthly income
- Total monthly spending
- Top spending categories
- Amount saved
- Charts or graphs showing your spending
Make sure your infographic is clear, colorful, and easy to understand.
